By Gigi Jones
Since the 1990s, the Integrated Postsecondary Education Data System (IPEDS) has collected and published graduation rates for colleges and universities around the country. These rates were based on traditional college students—first-time, full-time degree- or certificate-seeking undergraduate students (FTFT) who, generally, enrolled right after high school.
While these data are insightful, some have argued the FTFT graduation rate only provides a part of the picture because it doesn’t consider non-traditional students, including those who are part-time students and transfers. This is an important point because, over the past decade, the number of non-traditional students has outpaced the increase in traditional students, mostly driven by growth in those who have transferred schools.
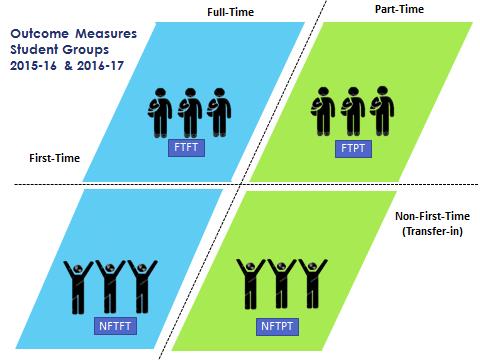
The new IPEDS Outcome Measures survey was designed to help answer these changes. Starting with the 2015-16 collection cycle, entering students at more than 4,000 degree-granting institutions must be reported in one of four buckets, also called cohorts (see Figure below).
The FTFT cohort is similar to what has been collected since the 1990s, but the Outcome Measures adds three new student groups to the equation:
- First-time, part-time students (FTPT), who attend less than a full-time credit workload each term (typically less than 12-credits) and who have no prior postsecondary attendance;
- Non-first-time students, also known as transfer-in students, who are enrolled at a full-time level (NFTFT); and
- Non-first-time students, also known as transfer-in students, who are enrolled at a part-time level (NFTPT).

For these four cohorts, postsecondary institutions report the awards conferred at two points of time after the students entered the institution: 6 years and 8 years. If students did not receive an award, then institutions must report their enrollment status one of three ways: 1) Still enrolled at the same institution; 2) Transferred out of the institution; or 3) Enrollment status is unknown.
These changes help respond to those who feel that the FTFT graduation rates do not reflect the larger student population, in particular public 2-year colleges that serve a larger, non-traditional college student population. Since 2008, steps have been taken to construct and refine the data collection of non-traditional college students through a committee of higher education experts (PDF) and public Technical Review Panels (see summaries for panels 37, 40 and 45).
The 2016-17 preliminary Outcome Measures data were released on October 12, as part of a larger report on IPEDS winter data collection. The data for individual schools can be found on our College Navigator site. The final data for 2015-16 will be released in early 2018. Sign up for the IES News Flash to be notified when the new data are released or follow IPEDS on Twitter. You can also visit the IPEDS Outcome Measures website for more information.
While this is an important step in the process, we are continuing to improve the data collection process. Starting with the 2017-18 Outcome Measures collection, the survey includes more groups (i.e., Pell Grant v. Non-Pell Grant recipients), a third award status point (4-years after entry), and the identification of the type of award (i.e., certificates, Associate’s, and Bachelor’s). Watch for the release of these data in fall 2018.
EDITOR'S NOTE: This post was updated on October 12 to reflect the release of Outcome Measures data.